Performance
A compelling reason for using React Native instead of WebView-based tools is to achieve 60 frames per second and a native look and feel to your apps. Where possible, we would like for React Native to do the right thing and help you to focus on your app instead of performance optimization, but there are areas where we're not quite there yet, and others where React Native (similar to writing native code directly) cannot possibly determine the best way to optimize for you and so manual intervention will be necessary. We try our best to deliver buttery-smooth UI performance by default, but sometimes that just isn't possible.
This guide is intended to teach you some basics to help you to troubleshoot performance issues, as well as discuss common sources of problems and their suggested solutions.
What you need to know about frames
Your grandparents' generation called movies "moving pictures" for a reason: realistic motion in video is an illusion created by quickly changing static images at a consistent speed. We refer to each of these images as frames. The number of frames that is displayed each second has a direct impact on how smooth and ultimately life-like a video (or user interface) seems to be. iOS devices display 60 frames per second, which gives you and the UI system about 16.67ms to do all of the work needed to generate the static image (frame) that the user will see on the screen for that interval. If you are unable to do the work necessary to generate that frame within the allotted 16.67ms, then you will "drop a frame" and the UI will appear unresponsive.
Now to confuse the matter a little bit, open up the developer menu in your app and toggle Show Perf Monitor. You will notice that there are two different frame rates.

JS frame rate (JavaScript thread)
For most React Native applications, your business logic will run on the JavaScript thread. This is where your React application lives, API calls are made, touch events are processed, etc... Updates to native-backed views are batched and sent over to the native side at the end of each iteration of the event loop, before the frame deadline (if all goes well). If the JavaScript thread is unresponsive for a frame, it will be considered a dropped frame. For example, if you were to call this.setState on the root component of a complex application and it resulted in re-rendering computationally expensive component subtrees, it's conceivable that this might take 200ms and result in 12 frames being dropped. Any animations controlled by JavaScript would appear to freeze during that time. If anything takes longer than 100ms, the user will feel it.
This often happens during Navigator transitions: when you push a new route, the JavaScript thread needs to render all of the components necessary for the scene in order to send over the proper commands to the native side to create the backing views. It's common for the work being done here to take a few frames and cause jank because the transition is controlled by the JavaScript thread. Sometimes components will do additional work on componentDidMount, which might result in a second stutter in the transition.
Another example is responding to touches: if you are doing work across multiple frames on the JavaScript thread, you might notice a delay in responding to TouchableOpacity, for example. This is because the JavaScript thread is busy and cannot process the raw touch events sent over from the main thread. As a result, TouchableOpacity cannot react to the touch events and command the native view to adjust its opacity.
UI frame rate (main thread)
Many people have noticed that performance of NavigatorIOS is better out of the box than Navigator. The reason for this is that the animations for the transitions are done entirely on the main thread, and so they are not interrupted by frame drops on the JavaScript thread.
Similarly, you can happily scroll up and down through a ScrollView when the JavaScript thread is locked up because the ScrollView lives on the main thread. The scroll events are dispatched to the JS thread, but their receipt is not necessary for the scroll to occur.
Common sources of performance problems
Running in development mode (dev=true)
JavaScript thread performance suffers greatly when running in dev mode. This is unavoidable: a lot more work needs to be done at runtime to provide you with good warnings and error messages, such as validating propTypes and various other assertions. Always make sure to test performance in release builds.
Using console.log statements
When running a bundled app, these statements can cause a big bottleneck in the JavaScript thread. This includes calls from debugging libraries such as redux-logger, so make sure to remove them before bundling. You can also use this babel plugin that removes all the console.* calls. You need to install it first with npm i babel-plugin-transform-remove-console --save, and then edit the .babelrc file under your project directory like this:
{
  "env": {
    "production": {
      "plugins": ["transform-remove-console"]
    }
  }
}
This will automatically remove all console.* calls in the release (production) versions of your project.
ListView initial rendering is too slow or scroll performance is bad for large lists
Use the new FlatList or SectionList component instead. Besides simplifying the API, the new list components also have significant performance enhancements, the main one being nearly constant memory usage for any number of rows.
If your FlatList is rendering slow, be sure that you've implemented getItemLayout to optimize rendering speed by skipping measurement of the rendered items.
JS FPS plunges when re-rendering a view that hardly changes
If you are using a ListView, you must provide a rowHasChanged function that can reduce a lot of work by quickly determining whether or not a row needs to be re-rendered. If you are using immutable data structures, this would be as simple as a reference equality check.
Similarly, you can implement shouldComponentUpdate and indicate the exact conditions under which you would like the component to re-render. If you write pure components (where the return value of the render function is entirely dependent on props and state), you can leverage PureRenderMixin to do this for you. Once again, immutable data structures are useful to keep this fast -- if you have to do a deep comparison of a large list of objects, it may be that re-rendering your entire component would be quicker, and it would certainly require less code.
Dropping JS thread FPS because of doing a lot of work on the JavaScript thread at the same time
"Slow Navigator transitions" is the most common manifestation of this, but there are other times this can happen. Using InteractionManager can be a good approach, but if the user experience cost is too high to delay work during an animation, then you might want to consider LayoutAnimation.
The Animated API currently calculates each keyframe on-demand on the JavaScript thread unless you set useNativeDriver: true, while LayoutAnimation leverages Core Animation and is unaffected by JS thread and main thread frame drops.
One case where I have used this is for animating in a modal (sliding down from top and fading in a translucent overlay) while initializing and perhaps receiving responses for several network requests, rendering the contents of the modal, and updating the view where the modal was opened from. See the Animations guide for more information about how to use LayoutAnimation.
Caveats:
- LayoutAnimation only works for fire-and-forget animations ("static" animations) -- if it must be interruptible, you will need to use
Animated.
Moving a view on the screen (scrolling, translating, rotating) drops UI thread FPS
This is especially true when you have text with a transparent background positioned on top of an image, or any other situation where alpha compositing would be required to re-draw the view on each frame. You will find that enabling shouldRasterizeIOS or renderToHardwareTextureAndroid can help with this significantly.
Be careful not to overuse this or your memory usage could go through the roof. Profile your performance and memory usage when using these props. If you don't plan to move a view anymore, turn this property off.
Animating the size of an image drops UI thread FPS
On iOS, each time you adjust the width or height of an Image component it is re-cropped and scaled from the original image. This can be very expensive, especially for large images. Instead, use the transform: [{scale}] style property to animate the size. An example of when you might do this is when you tap an image and zoom it in to full screen.
My TouchableX view isn't very responsive
Sometimes, if we do an action in the same frame that we are adjusting the opacity or highlight of a component that is responding to a touch, we won't see that effect until after the onPress function has returned. If onPress does a setState that results in a lot of work and a few frames dropped, this may occur. A solution to this is to wrap any action inside of your onPress handler in requestAnimationFrame:
handleOnPress() {
  // Always use TimerMixin with requestAnimationFrame, setTimeout and
  // setInterval
  this.requestAnimationFrame(() => {
    this.doExpensiveAction();
  });
}
Slow navigator transitions
As mentioned above, Navigator animations are controlled by the JavaScript thread. Imagine the "push from right" scene transition: each frame, the new scene is moved from the right to left, starting offscreen (let's say at an x-offset of 320) and ultimately settling when the scene sits at an x-offset of
- Each frame during this transition, the JavaScript thread needs to send a new x-offset to the main thread. If the JavaScript thread is locked up, it cannot do this and so no update occurs on that frame and the animation stutters.
One solution to this is to allow for JavaScript-based animations to be offloaded to the main thread. If we were to do the same thing as in the above example with this approach, we might calculate a list of all x-offsets for the new scene when we are starting the transition and send them to the main thread to execute in an optimized way. Now that the JavaScript thread is freed of this responsibility, it's not a big deal if it drops a few frames while rendering the scene -- you probably won't even notice because you will be too distracted by the pretty transition.
Solving this is one of the main goals behind the new React Navigation library. The views in React Navigation use native components and the Animated library to deliver 60 FPS animations that are run on the native thread.
Profiling
Use the built-in profiler to get detailed information about work done in the JavaScript thread and main thread side-by-side. Access it by selecting Perf Monitor from the Debug menu.
For iOS, Instruments is an invaluable tool, and on Android you should learn to use systrace.
But first, make sure that Development Mode is OFF! You should see __DEV__ === false, development-level warning are OFF, performance optimizations are ON in your application logs.
Another way to profile JavaScript is to use the Chrome profiler while debugging. This won't give you accurate results as the code is running in Chrome but will give you a general idea of where bottlenecks might be. Run the profiler under Chrome's Performance tab. A flame graph will appear under User Timing. To view more details in tabular format, click at the Bottom Up tab below and then select DedicatedWorker Thread at the top left menu.
Profiling Android UI Performance with systrace
Android supports 10k+ different phones and is generalized to support software rendering: the framework architecture and need to generalize across many hardware targets unfortunately means you get less for free relative to iOS. But sometimes, there are things you can improve -- and many times it's not native code's fault at all!
The first step for debugging this jank is to answer the fundamental question of where your time is being spent during each 16ms frame. For that, we'll be using a standard Android profiling tool called systrace.
systrace is a standard Android marker-based profiling tool (and is installed when you install the Android platform-tools package). Profiled code blocks are surrounded by start/end markers which are then visualized in a colorful chart format. Both the Android SDK and React Native framework provide standard markers that you can visualize.
1. Collecting a trace
First, connect a device that exhibits the stuttering you want to investigate to your computer via USB and get it to the point right before the navigation/animation you want to profile. Run systrace as follows:
$ <path_to_android_sdk>/platform-tools/systrace/systrace.py --time=10 -o trace.html sched gfx view -a <your_package_name>
A quick breakdown of this command:
timeis the length of time the trace will be collected in secondssched,gfx, andvieware the android SDK tags (collections of markers) we care about:schedgives you information about what's running on each core of your phone,gfxgives you graphics info such as frame boundaries, andviewgives you information about measure, layout, and draw passes-a <your_package_name>enables app-specific markers, specifically the ones built into the React Native framework.your_package_namecan be found in theAndroidManifest.xmlof your app and looks likecom.example.app
Once the trace starts collecting, perform the animation or interaction you care about. At the end of the trace, systrace will give you a link to the trace which you can open in your browser.
2. Reading the trace
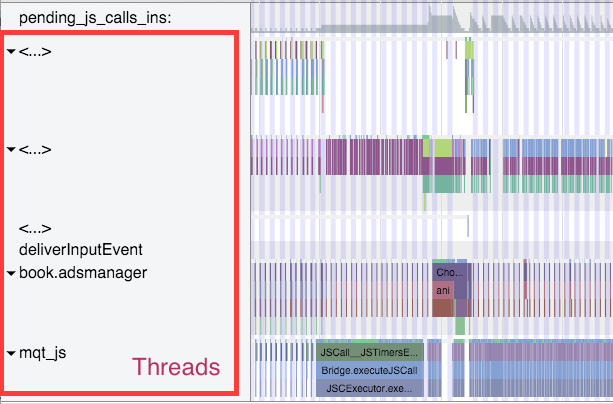
After opening the trace in your browser (preferably Chrome), you should see something like this:
HINT: Use the WASD keys to strafe and zoom
If your trace .html file isn't opening correctly, check your browser console for the following:

Since Object.observe was deprecated in recent browsers, you may have to open the file from the Google Chrome Tracing tool. You can do so by:
- Opening tab in chrome chrome://tracing
- Selecting load
- Selecting the html file generated from the previous command.
Enable VSync highlighting
Check this checkbox at the top right of the screen to highlight the 16ms frame boundaries:
You should see zebra stripes as in the screenshot above. If you don't, try profiling on a different device: Samsung has been known to have issues displaying vsyncs while the Nexus series is generally pretty reliable.
3. Find your process
Scroll until you see (part of) the name of your package. In this case, I was profiling com.facebook.adsmanager, which shows up as book.adsmanager because of silly thread name limits in the kernel.
On the left side, you'll see a set of threads which correspond to the timeline rows on the right. There are a few threads we care about for our purposes: the UI thread (which has your package name or the name UI Thread), mqt_js, and mqt_native_modules. If you're running on Android 5+, we also care about the Render Thread.
UI Thread. This is where standard android measure/layout/draw happens. The thread name on the right will be your package name (in my case book.adsmanager) or UI Thread. The events that you see on this thread should look something like this and have to do with
Choreographer,traversals, andDispatchUI: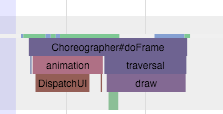
JS Thread. This is where JavaScript is executed. The thread name will be either
mqt_jsor<...>depending on how cooperative the kernel on your device is being. To identify it if it doesn't have a name, look for things likeJSCall,Bridge.executeJSCall, etc:
Native Modules Thread. This is where native module calls (e.g. the
UIManager) are executed. The thread name will be eithermqt_native_modulesor<...>. To identify it in the latter case, look for things likeNativeCall,callJavaModuleMethod, andonBatchComplete:
Bonus: Render Thread. If you're using Android L (5.0) and up, you will also have a render thread in your application. This thread generates the actual OpenGL commands used to draw your UI. The thread name will be either
RenderThreador<...>. To identify it in the latter case, look for things likeDrawFrameandqueueBuffer:
Identifying a culprit
A smooth animation should look something like the following:
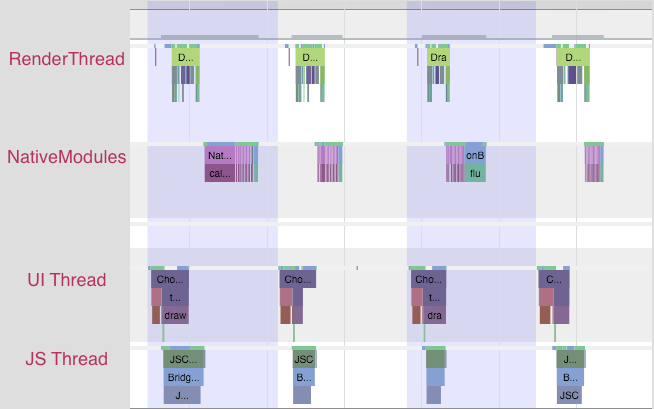
Each change in color is a frame -- remember that in order to display a frame, all our UI work needs to be done by the end of that 16ms period. Notice that no thread is working close to the frame boundary. An application rendering like this is rendering at 60 FPS.
If you noticed chop, however, you might see something like this:
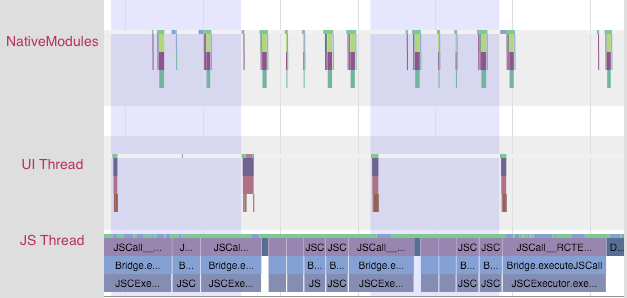
Notice that the JS thread is executing basically all the time, and across frame boundaries! This app is not rendering at 60 FPS. In this case, the problem lies in JS.
You might also see something like this:

In this case, the UI and render threads are the ones that have work crossing frame boundaries. The UI that we're trying to render on each frame is requiring too much work to be done. In this case, the problem lies in the native views being rendered.
At this point, you'll have some very helpful information to inform your next steps.
Resolving JavaScript issues
If you identified a JS problem, look for clues in the specific JS that you're executing. In the scenario above, we see RCTEventEmitter being called multiple times per frame. Here's a zoom-in of the JS thread from the trace above:

This doesn't seem right. Why is it being called so often? Are they actually different events? The answers to these questions will probably depend on your product code. And many times, you'll want to look into shouldComponentUpdate.
Resolving native UI Issues
If you identified a native UI problem, there are usually two scenarios:
- the UI you're trying to draw each frame involves too much work on the GPU, or
- You're constructing new UI during the animation/interaction (e.g. loading in new content during a scroll).
Too much GPU work
In the first scenario, you'll see a trace that has the UI thread and/or Render Thread looking like this:

Notice the long amount of time spent in DrawFrame that crosses frame boundaries. This is time spent waiting for the GPU to drain its command buffer from the previous frame.
To mitigate this, you should:
- investigate using
renderToHardwareTextureAndroidfor complex, static content that is being animated/transformed (e.g. theNavigatorslide/alpha animations) - make sure that you are not using
needsOffscreenAlphaCompositing, which is disabled by default, as it greatly increases the per-frame load on the GPU in most cases.
If these don't help and you want to dig deeper into what the GPU is actually doing, you can check out Tracer for OpenGL ES.
Creating new views on the UI thread
In the second scenario, you'll see something more like this:
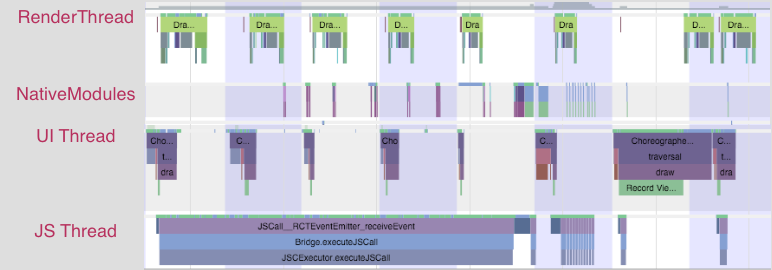
Notice that first the JS thread thinks for a bit, then you see some work done on the native modules thread, followed by an expensive traversal on the UI thread.
There isn't an easy way to mitigate this unless you're able to postpone creating new UI until after the interaction, or you are able to simplify the UI you're creating. The react native team is working on a infrastructure level solution for this that will allow new UI to be created and configured off the main thread, allowing the interaction to continue smoothly.
Unbundling + inline requires
If you have a large app you may want to consider unbundling and using inline requires. This is useful for apps that have a large number of screens which may not ever be opened during a typical usage of the app. Generally it is useful to apps that have large amounts of code that are not needed for a while after startup. For instance the app includes complicated profile screens or lesser used features, but most sessions only involve visiting the main screen of the app for updates. We can optimize the loading of the bundle by using the unbundle feature of the packager and requiring those features and screens inline (when they are actually used).
Loading JavaScript
Before react-native can execute JS code, that code must be loaded into memory and parsed. With a standard bundle if you load a 50mb bundle, all 50mb must be loaded and parsed before any of it can be executed. The optimization behind unbundling is that you can load only the portion of the 50mb that you actually need at startup, and progressively load more of the bundle as those sections are needed.
Inline Requires
Inline requires delay the requiring of a module or file until that file is actually needed. A basic example would look like this:
VeryExpensive.js
import React, { Component } from 'react';
import { Text } from 'react-native';
// ... import some very expensive modules

// You may want to log at the file level to verify when this is happening
console.log('VeryExpensive component loaded');

export default class VeryExpensive extends Component {
  // lots and lots of code
  render() {
    return <Text>Very Expensive Component</Text>;
  }
}
Optimized.js
import React, { Component } from 'react';
import { TouchableOpacity, View, Text } from 'react-native';

let VeryExpensive = null;

export default class Optimized extends Component {
  state = { needsExpensive: false };

  didPress = () => {
    if (VeryExpensive == null) {
      VeryExpensive = require('./VeryExpensive').default;
    }

    this.setState(() => ({
      needsExpensive: true,
    }));
  };

  render() {
    return (
      <View style={{ marginTop: 20 }}>
        <TouchableOpacity onPress={this.didPress}>
          <Text>Load</Text>
        </TouchableOpacity>
        {this.state.needsExpensive ? <VeryExpensive /> : null}
      </View>
    );
  }
}
Even without unbundling inline requires can lead to startup time improvements, because the code within VeryExpensive.js will only execute once it is required for the first time.
Enable Unbundling
On iOS unbundling will create a single indexed file that react native will load one module at a time. On Android, by default it will create a set of files for each module. You can force Android to create a single file, like iOS, but using multiple files can be more performant and requires less memory.
Enable unbundling in Xcode by editing the build phase "Bundle React Native code and images". Before ../node_modules/react-native/packager/react-native-xcode.sh add export BUNDLE_COMMAND="unbundle":
export BUNDLE_COMMAND="unbundle"
export NODE_BINARY=node
../node_modules/react-native/packager/react-native-xcode.sh
On Android enable unbundling by editing your android/app/build.gradle file. Before the line apply from: "../../node_modules/react-native/react.gradle" add or amend the project.ext.react block:
project.ext.react = [
  bundleCommand: "unbundle",
]
Use the following lines on Android if you want to use a single indexed file:
project.ext.react = [
  bundleCommand: "unbundle",
  extraPackagerArgs: ["--indexed-unbundle"]
]
Configure Preloading and Inline Requires
Now that we have unbundled our code, there is overhead for calling require. require now needs to send a message over the bridge when it encounters a module it has not loaded yet. This will impact startup the most, because that is where the largest number of require calls are likely to take place while the app loads the initial module. Luckily we can configure a portion of the modules to be preloaded. In order to do this, you will need to implement some form of inline require.
Adding a packager config file
Create a folder in your project called packager, and create a single file named config.js. Add the following:
const config = {
  getTransformOptions: () => {
    return {
      transform: { inlineRequires: true },
    };
  },
};

module.exports = config;
In Xcode, in the build phase, include export BUNDLE_CONFIG="packager/config.js".
export BUNDLE_COMMAND="unbundle"
export BUNDLE_CONFIG="packager/config.js"
export NODE_BINARY=node
../node_modules/react-native/packager/react-native-xcode.sh
Edit your android/app/build.gradle file to include bundleConfig: "packager/config.js",.
project.ext.react = [
  bundleCommand: "unbundle",
  bundleConfig: "packager/config.js"
]
Finally, you can update "start" under "scripts" on your package.json to use the config:
"start": "node node_modules/react-native/local-cli/cli.js start --config ../../../../packager/config.js",
Start your package server with npm start. Note that when the dev packager is automatically launched via xcode and react-native run-android, etc, it does not use npm start, so it won't use the config.
Investigating the Loaded Modules
In your root file (index.(ios|android).js) you can add the following after the initial imports:
const modules = require.getModules();
const moduleIds = Object.keys(modules);
const loadedModuleNames = moduleIds
  .filter(moduleId => modules[moduleId].isInitialized)
  .map(moduleId => modules[moduleId].verboseName);
const waitingModuleNames = moduleIds
  .filter(moduleId => !modules[moduleId].isInitialized)
  .map(moduleId => modules[moduleId].verboseName);

// make sure that the modules you expect to be waiting are actually waiting
console.log(
  'loaded:',
  loadedModuleNames.length,
  'waiting:',
  waitingModuleNames.length
);

// grab this text blob, and put it in a file named packager/moduleNames.js
console.log(`module.exports = ${JSON.stringify(loadedModuleNames.sort())};`);
When you run your app, you can look in the console and see how many modules have been loaded, and how many are waiting. You may want to read the moduleNames and see if there are any surprises. Note that inline requires are invoked the first time the imports are referenced. You may need to investigate and refactor to ensure only the modules you want are loaded on startup. Note that you can change the Systrace object on require to help debug problematic requires.
require.Systrace.beginEvent = (message) => {
  if(message.includes(problematicModule)) {
    throw new Error();
  }
}
Every app is different, but it may make sense to only load the modules you need for the very first screen. When you are satisified, put the output of the loadedModuleNames into a file named packager/moduleNames.js.
Transforming to Module Paths
The loaded module names get us part of the way there, but we actually need absolute module paths, so the next script will set that up. Add packager/generateModulePaths.js to your project with the following:
// @flow
/* eslint-disable no-console */
const execSync = require('child_process').execSync;
const fs = require('fs');
const moduleNames = require('./moduleNames');

const pjson = require('../package.json');
const localPrefix = `${pjson.name}/`;

const modulePaths = moduleNames.map(moduleName => {
  if (moduleName.startsWith(localPrefix)) {
    return `./${moduleName.substring(localPrefix.length)}`;
  }
  if (moduleName.endsWith('.js')) {
    return `./node_modules/${moduleName}`;
  }
  try {
    const result = execSync(
      `grep "@providesModule ${moduleName}" $(find . -name ${moduleName}\\\\.js) -l`
    )
      .toString()
      .trim()
      .split('\n')[0];
    if (result != null) {
      return result;
    }
  } catch (e) {
    return null;
  }
  return null;
});

const paths = modulePaths
  .filter(path => path != null)
  .map(path => `'${path}'`)
  .join(',\n');

const fileData = `module.exports = [${paths}];`;

fs.writeFile('./packager/modulePaths.js', fileData, err => {
  if (err) {
    console.log(err);
  }

  console.log('Done');
});
You can run via node packager/modulePaths.js.
This script attempts to map from the module names to module paths. Its not foolproof though, for instance, it ignores platform specific files (*ios.js, and *.android.js). However based on initial testing, it handles 95% of cases. When it runs, after some time it should complete and output a file named packager/modulePaths.js. It should contain paths to module files that are relative to your projects root. You can commit modulePaths.js to your repo so it is transportable.
Updating the config.js
Returning to packager/config.js we should update it to use our newly generated modulePaths.js file.
const modulePaths = require('./modulePaths');
const resolve = require('path').resolve;
const fs = require('fs');

const config = {
  getTransformOptions: () => {
    const moduleMap = {};
    modulePaths.forEach(path => {
      if (fs.existsSync(path)) {
        moduleMap[resolve(path)] = true;
      }
    });
    return {
      preloadedModules: moduleMap,
      transform: { inlineRequires: { blacklist: moduleMap } },
    };
  },
};

module.exports = config;
The preloadedModules entry in the config indicates which modules should be marked as preloaded by the unbundler. When the bundle is loaded, those modules are immediately loaded, before any requires have even executed. The blacklist entry indicates that those modules should not be required inline. Because they are preloaded, there is no performance benefit from using an inline require. In fact the javascript spends extra time resolving the inline require every time the imports are referenced.
Test and Measure Improvements
You should now be ready to build your app using unbundling and inline requires. Make sure you measure the before and after startup times.

